GMP Validated SPC

Turn Complex Pharma Data Into Actionable Intelligence

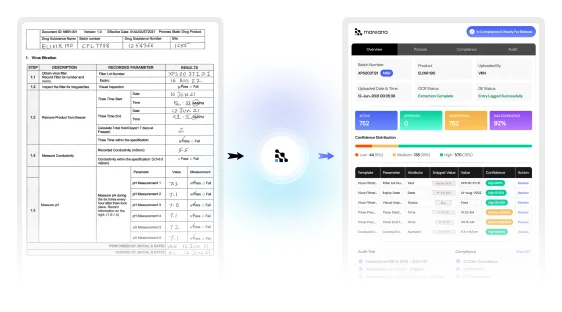
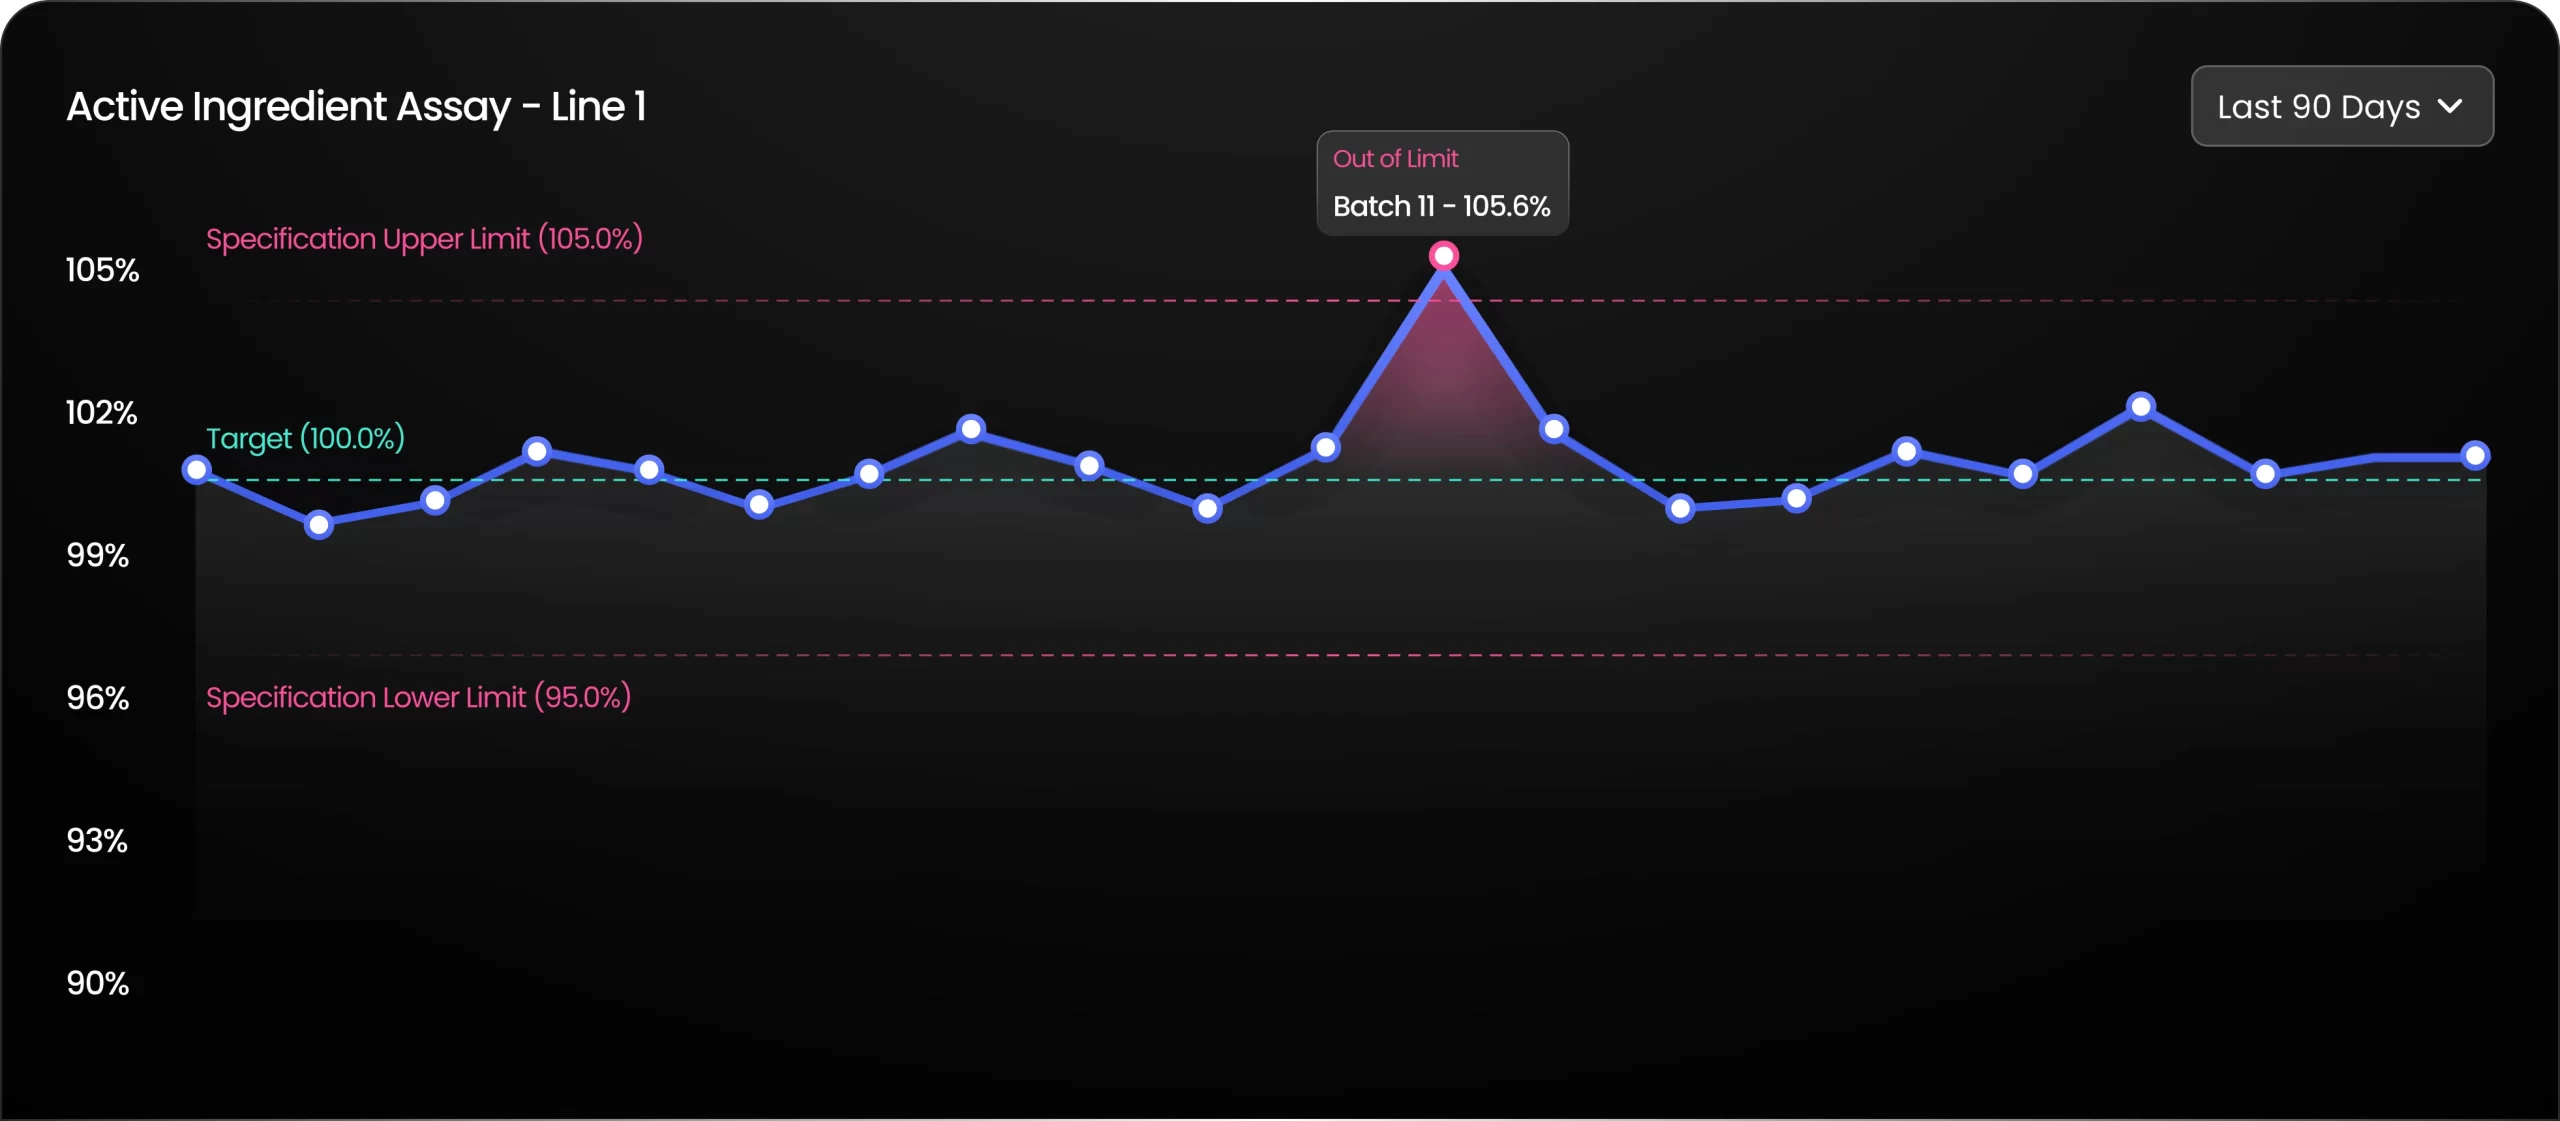
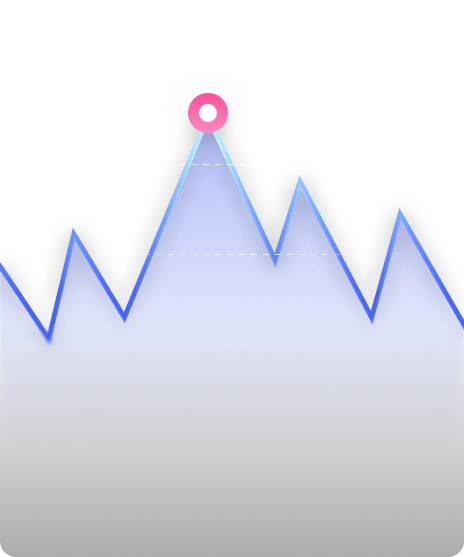
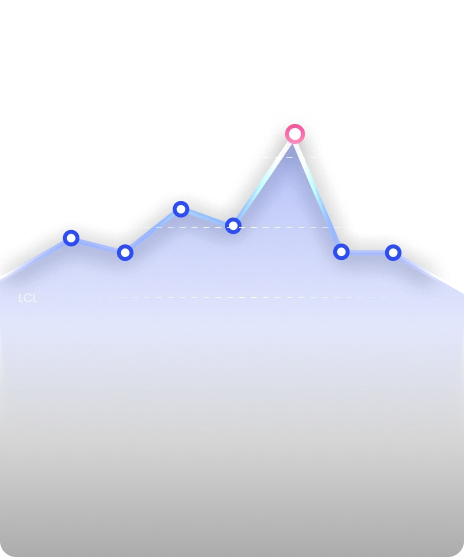
Mareana Charts is a GMP validated CPV and SPC platform for pharmaceutical manufacturing that automates chart generation, embeds Nelson and Westgard rules, and enables real time operational investigation workflows.

Book a Demo Book a Demo
Turn Complex Pharma Data Into Actionable Intelligence
Trusted by pharma &
life sciences teams at
Solenis
Johnson & Johnson
Merck
Bristol Myers Squibb
Kenvue
Solenis
Johnson & Johnson
Merck
Bristol Myers Squibb
Kenvue

We lose weeks rebuilding charts for compliance and lose trust when moving fast with BI tools. Mareana Charts brings audit ready rigor and rapid investigation into one validated workflow

How Automated CPV Reporting Works in Mareana Charts

Built to eliminate manual reporting bottlenecks with a validated, automated workflow for faster, audit ready CPV reporting.
01

Configure Once

Define products, parameters, limits, and chart types in one reusable configuration.
02

Auto-Ingest Data

Pull contextualized data directly from LIMS, MES, and ERP systems without manual extraction.
03

Apply Validated Statistics

Automatically execute SPC rules, Westgard checks, and CPK calculations using validated logic.
04

Schedule & Monitor

Generate version controlled reports with automated alerts and rule-based routing.

From Detection to Action

Mareana Charts connects SPC rule detection, automated alerting, and owner-level response in a single traceable workflow turning statistical signals into immediate operational action.
Real Time SPC Monitoring & Alert Routing

Real Time SPC Monitoring & Alert Routing

Detects Nelson Rule violations directly inside live SPC charts and automatically routes contextual alerts to the responsible owner connecting chart, signal, notification, and action in a single validated workflow.
Preset Driven Statistical Configuration

Preset Driven Statistical Configuration

Start with predefined product risk tiers, then expand into fully traceable Nelson and Westgard rule configurations giving quality teams a faster path to standardized, audit defensible SPC monitoring.
Configurable Nelson, Westgard and WECO Rules for

Configurable Nelson, Westgard and WECO Rules for Early Drift Detection

Enable early process drift detection with a validated library of Nelson Rules 1-8, Westgaard rules, and WECO rules, configurable by parameter and risk tier.
  • svgviewer-output

    Early detection of process drift
  • Validated rules, ready to use
  • Automated alerts & notifications
Book a Demo Book a Demo

Advanced SPC & Quality Charts

Visualize deviations, process stability, variability, and operational trends through interactive statistical analytics designed for pharma manufacturing.
bar-chart

Bar Chart

Compare counts across batches, lines, or departments.
box-plot

Box Plot

Identify spread, median shifts, and QA outliers instantly.
distribution-chart

Distribution Chart

Visualize data distribution and understand process variation.
process-control

Process Control

Detect process drift and control limit violations in real time.
histogram-chart

Histogram

Understand data distribution and process performance.
EWMA

EWMA Chart

Monitor small shifts in the process mean with greater sensitivity.
heatmap

Heatmap

Identify high-impact areas and patterns at a glance.
line-chart

Line Chart

Track process trends and stability across batches.
scatter-plot

Scatter Plot

dentify outliers, process drift, and variability across batches and process parameters.

21 CFR Part 11 Compliance: Native Version Control, Change Control, and Audit Traceability

Every Mareana chart object carries native version history, electronic approval workflows, and an immutable audit trail recording user, timestamp, and configuration. Auditors can reproduce any historical chart used in a prior APR or PQR without forensic spreadsheet archaeology.
Immutable Audit Trail
Every action is recorded
Electronic Signatures
21 CFR Part 11 Compliant
21 CFR Part 11 Compliance: Native Version Control, Change Control, and

See Something Unusual?
Ask Lumis.

Lumis helps teams investigate anomalies, compare batches, and uncover root causes directly from their charts.
Every response links back to the source:
SPC events & rule violations
MES batch execution records
LIMS analytical results
Equipment & maintenance logs
Historical process baselines
Cross site CPV trend comparisons

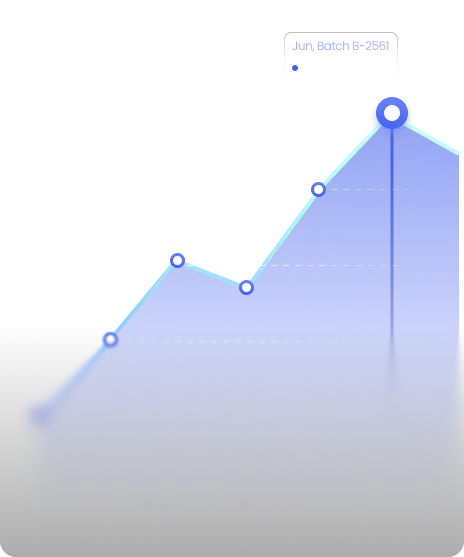
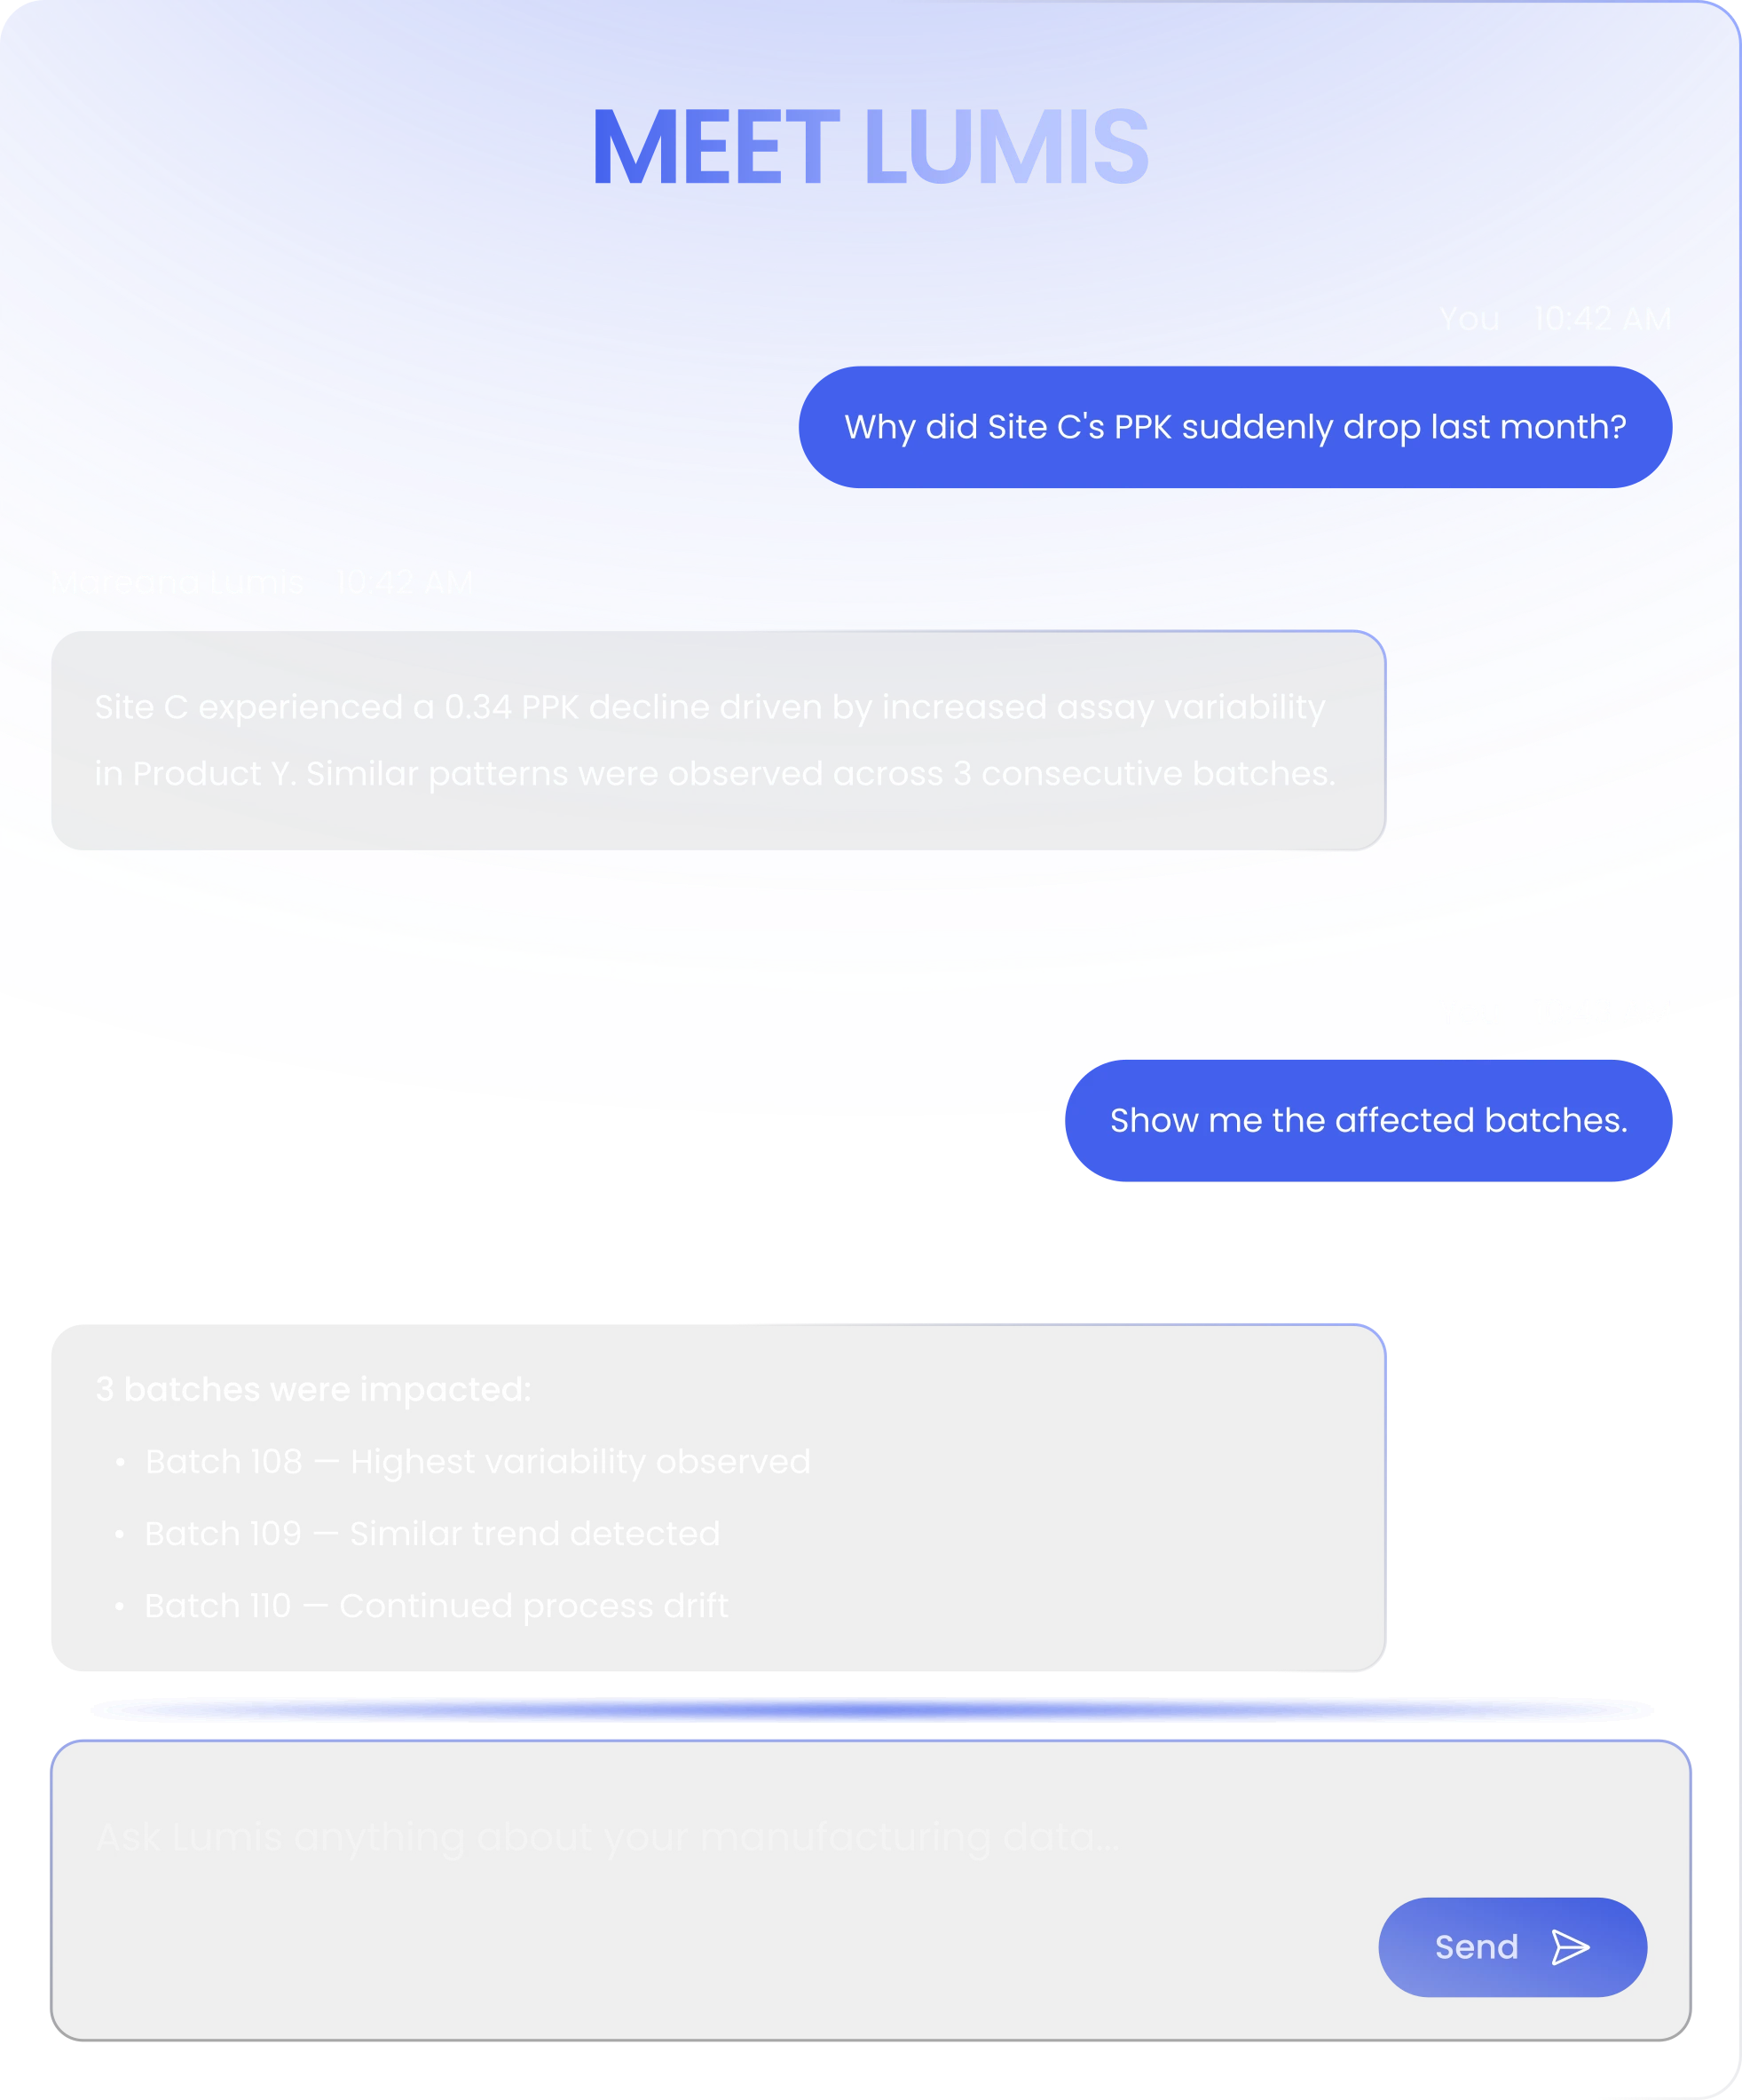
Want to see Lumis investigate a real CPV signal?

Book a Demo Book a Demo
Ask Lumis.

Connect LIMS, MES, and ERP Systems Without a Data Lake

Mareana Charts connects directly to existing manufacturing systems through pre built connectors, transforming raw operational data into CPV ready insights without manual data consolidation or complex infrastructure projects.
LIMS
LabWare LIMS LabVantage Thermo SampleManager STARLIMS LabWare LIMS LabVantage Thermo SampleManager STARLIMS
ERP
SAP ECC SAP S/4HANA Oracle EBS Oracle ERP Cloud SAP ECC SAP S/4HANA Oracle EBS Oracle ERP Cloud
MES
Werum PAS-X Rockwell PharmaSuite Emerson DeltaV Korber Werum Werum PAS-X Rockwell PharmaSuite Emerson DeltaV Korber Werum
HISTORIAN
OSIsoft PI AVEVA PI System Honeywell PHD Aspen IP.21 OSIsoft PI AVEVA PI System Honeywell PHD Aspen IP.21
REST APIs Custom Connectors Database Adapters

Real Outcomes From Real Manufacturing Teams

From CPV reporting to OOT detection, quality organizations are transforming how they monitor, investigate, and release products.
90%
Reduction in CPV Reporting Effort
Hours
Instead of Days for Investigations
21 CFR Part 11
Compliant by Design
Book a Demo Book a Demo

Got Questions?
We’ve Got Answers.

Configure once, then automatically generate audit ready SPC reports from connected pharma systems.

Yes. Mareana Charts provides validated SPC analysis with Nelson and Westgard rules built in, eliminating the need for separate statistical tools while maintaining full compliance traceability.

Automated Nelson and Westgard rule monitoring detects process drift in real time, routing contextual alerts to responsible owners before issues escalate to OOT events.

Every chart carries native version history, electronic signatures, and an immutable audit trail recording user, timestamp, and configuration changes — fully aligned with 21 CFR Part 11.

Need More Information?

Connect with our experts to learn how Mareana Charts helps pharma teams automate SPC monitoring, detect process drift early, and stay inspection ready.

Ready to Modernize Pharma QA Analytics?

Transform deviations, SPC monitoring, and quality insights into actionable decisions with real time visual analytics built for regulated manufacturing.
Book a Demo Book a Demo
area-chart
box-plot
bar-chart
8 AI use cases to transform your quality assurance.
/ BEFORE YOU GO

8 AI use cases to transform your quality assurance.

By signing up, you agree to the Privacy Policy.