Summary
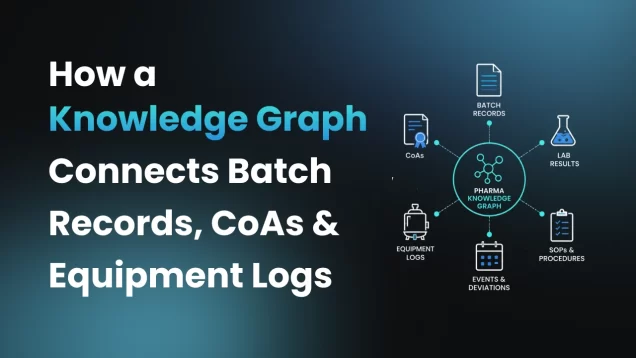
Pharmaceutical manufacturing generates vast amounts of data across batch records, Certificates of Analysis (CoAs), equipment logs, laboratory systems, quality systems, and paper documentation. While each system captures an important part of the manufacturing process, these records often remain disconnected, making it difficult for quality and manufacturing teams to quickly trace relationships, investigate deviations, prepare for audits, or assess the impact of material and equipment issues.
A manufacturing knowledge graph addresses this challenge by connecting these records into a single, queryable network that preserves the relationships between batches, materials, equipment, test results, and quality events. By bringing together structured and unstructured data, manufacturers can gain complete manufacturing context, accelerate investigations, improve recall readiness, simplify annual product reviews, strengthen cross-site visibility, and support regulatory compliance with end-to-end traceability.
Every pharmaceutical batch leaves behind a trail of evidence. There are executed batch records – paper, hybrid, or electronic, documenting each manufacturing step. There are certificates of analysis from raw material suppliers, confirming the identity, purity, and potency of every incoming lot. There are equipment logs capturing calibration dates, maintenance history, and qualification status. There are in-process test results from the lab, environmental monitoring records from classified rooms, operator signoffs, deviation entries, and stability data.
Individually, each of these records is valuable. Together, they tell the complete story of how a product was made, whether it was made correctly, and what to investigate when something goes wrong.
The problem is that together is rarely how they exist. In most pharmaceutical manufacturing operations, these records live in separate systems, maintained by separate departments, in formats that do not communicate with each other. A quality professional investigating a deviation must visit each system in turn, extract whatever data is accessible, and manually reconstruct the manufacturing story that the data collectively describes.
A manufacturing knowledge graph eliminates this reconstruction step. It connects batch records, material certificates, equipment logs, and every other relevant data source into a single, continuously maintained, queryable network, so the manufacturing story is already assembled when it is needed.
The Core Problem: Pharmaceutical Data Exists in Silos That Were Never Designed to Connect
To understand why a knowledge graph matters, it helps to be specific about the disconnection that exists in most pharmaceutical manufacturing environments today.
Pharmaceutical Data Lives in Silos That Were Never Designed to Connect
Six systems. Six departments. Zero shared query layer.
A typical commercial manufacturing site operates across a stack of systems that includes some combination of an ERP for materials management and batch disposition, a LIMS for laboratory data and QC results, an MES for production execution and operator entries, a data historian for continuous process parameter capture, a QMS for deviations, CAPAs, and change control, and a document management system for controlled procedures and batch record templates. Each of these systems was designed and validated for a specific function. None was designed to be queried across all the others simultaneously.
When a quality team needs to answer a question that crosses system boundaries like which batches used Raw Material Lot RM-4471, and what were their yields?, the answer requires a manual join across at least three systems. Someone queries the ERP for batch disposition records linked to that lot number. Someone queries the LIMS for the associated yield results. Someone cross-references the batch records to confirm the lot number appears in the correct step. The identifiers may not match exactly. The timestamps may be in different formats. The query that should take minutes takes days.
This is not an edge case. It is the daily operational reality for quality, manufacturing, and MSAT teams at pharmaceutical companies of every size. The friction is structural – it is built into the architecture of siloed systems, and it compounds every investigation, every product review, every audit preparation, and every regulatory submission.
Paper adds another layer of disconnection
For many manufacturers, the challenge extends beyond electronic systems. Paper batch records, supplier certificates of analysis received as scanned PDFs, equipment logbooks maintained on the shop floor, and stability study records from contract laboratories all contain critical manufacturing data that exists outside any queryable system.
A paper batch record may document the exact quantities charged, the equipment used, the operator sign-off at each step, and any process notes that don’t make it into the MES. A supplier certificate of analysis carries the specification confirmation for every raw material attribute. These documents are legally required and operationally essential. But because they are unstructured, they are functionally invisible to any query unless someone reads them manually.
The result is a manufacturing data environment where some information is electronic but siloed across disconnected systems, some is paper-based and unstructured, and the relationships between all of it exist only in the heads of experienced operators and quality professionals.
What a Manufacturing Knowledge Graph Actually Is
A knowledge graph is a data structure in which information is organized as a network of nodes and edges. Nodes represent entities in pharmaceutical manufacturing, these include batches, raw material lots, finished product lots, equipment units, operators, test results, process steps, and deviations. Edges represent the relationships between those entities – a batch was made from a raw material lot, a process step was executed on a specific equipment unit, a test result was generated for a specific batch at a specific stage.
What distinguishes a knowledge graph from a conventional database is not the storage technology but the structure. A relational database stores records in tables, with relationships implied through foreign key joins that must be defined at query time. A knowledge graph stores the relationships themselves as first-class data.
This is important for root cause analysis and process trending. If a parameter that contributes to a current investigation was captured on paper during the development phase and electronically during commercial manufacturing, both data sets need to be queryable in the same network. A knowledge graph that spans paper and electronic records makes this possible.
How Material Certificates Enter the Knowledge Graph
In a typical pharmaceutical manufacturing operation, CoAs arrive as PDFs – either emailed, uploaded to a supplier portal, or delivered with the physical shipment.
The operational challenge with CoAs is that they contain data that is directly relevant to batch manufacturing decisions. Release of incoming materials, identification of potentially non-conforming lots, traceability in recall scenarios but that data is locked in a PDF. It is not queryable. It cannot be automatically associated with the batches that used that material lot. It cannot be trended across suppliers or across time.
When CoAs are ingested into a manufacturing knowledge graph through AI-powered document processing, the structured data they contain – each tested attribute, each specification limit, each result becomes a set of attributes on the raw material lot node. The graph then connects that node to every batch in which that lot was used.
This creates capabilities that do not exist in a CoA-as-PDF environment:
Lot-to-batch linkage at scale. Given a supplier lot number, the graph immediately returns every batch that used that lot and the process step at which it was consumed. This is the foundation of rapid recall readiness.
Specification trending across incoming lots. By querying the attributes of all incoming lots for a given material from a given supplier over time, quality and procurement teams can detect whether supplier quality is drifting before a non-conforming lot reaches manufacturing.
Cross-parameter correlation. When raw material attributes are stored as node properties in the graph, it becomes possible to correlate specific attribute values with downstream batch performance. If moisture content in a particular excipient consistently correlates with variation in tablet hardness, that relationship is detectable but only when CoA data and batch performance data are in the same connected network.
The CDMO and multi-supplier context
For pharmaceutical companies operating through contract manufacturing organizations, the material certificate challenge is compounded. A sponsor may receive finished drug product from a CDMO along with a package of manufacturing documentation that includes batch records, CoAs for all raw materials used, and equipment qualification records. This documentation package represents the complete manufacturing record but in a PDF bundle, not a queryable network.
When CDMO documentation is ingested into a knowledge graph, the sponsor gains visibility into the connected manufacturing data for products made outside their own facilities. They can query the raw material lots used by the CDMO for their product, compare CoA attributes across batches, and identify whether any supply chain variation is influencing product quality without requiring the CDMO to change their systems or adopt a new data format.
How Equipment Logs Enter the Knowledge Graph
Equipment qualification and maintenance records are among the most frequently referenced documents during regulatory inspections and deviation investigations. When a product quality failure is under investigation, one of the first questions a quality team asks is whether the equipment used in the affected process step was in a qualified state at the time of manufacture.
In most manufacturing environments, equipment records are maintained in a CMMS or as controlled documents in the DMS, separate from the batch records that reference that equipment. Demonstrating that a specific equipment unit was in calibration during a specific batch run requires manually cross-referencing the batch record for the equipment identifier, then searching the equipment system for the calibration record covering that date.
When equipment logs are connected to the manufacturing knowledge graph, each equipment unit becomes a node. Its attributes include current qualification status, calibration due dates, maintenance history, and the complete log of batches on which it has been used. The graph edge connecting an equipment node to a batch node is created at manufacturing time, when the batch record, records which equipment was used at which step.
This connection enables several capabilities that are not available when equipment records are siloed:
Equipment-to-batch impact assessment. If an equipment unit is found to have been out of calibration during a specific period, the graph immediately returns every batch processed on that unit during that window.
Maintenance correlation with process performance. By querying the relationship between maintenance events on a specific piece of equipment and process parameter behavior in the batches that followed, process engineers can identify whether maintenance activities are associated with process variation – potentially revealing opportunities for predictive maintenance scheduling.
Qualification gap detection. A graph query across all batches manufactured in a given period can flag any instances where an equipment unit’s qualification was due for review at the time of use, providing a proactive compliance check rather than a reactive audit finding.
The Single Queryable Network: What Changes Operationally
When batch records, material certificates, and equipment logs are all nodes in the same connected graph, the operational experience of working with manufacturing data changes in several concrete ways.
What Changes When Everything Is Connected
The same work. A fundamentally different starting point.
Investigations that start with context, not with data gathering
When a deviation is logged, the graph already contains the manufacturing context for the affected batch. The quality team does not need to request data from multiple systems. The investigation can begin with analysis on day one rather than with data logistics that extend the investigation window by days or weeks.
Audit responses that take minutes, not days
During a regulatory inspection, an investigator may ask for the batch records and associated raw material CoAs for a specific product over a twelve-month period, along with the calibration records for the filling line used.
In a connected knowledge graph, the query returns all associated records – batch data, CoA attributes, equipment qualification status in a single traversal. The response time is measured in minutes. The completeness of the response is guaranteed by the graph’s structure rather than by the vigilance of the team assembling the response.
Annual product reviews that build themselves
The annual product quality review requires aggregating manufacturing, quality, and analytical data across every batch of a product manufactured during the review period. In most organizations, this aggregation is a months-long manual exercise.
When all this data is already connected in a manufacturing knowledge graph, the APR is it is queried. The graph returns the batch count, yield distribution, deviation summary, raw material lot usage, and analytical trending for the review period. The review team spends its time evaluating the data rather than collecting it.
Cross-site consistency for global operations
For pharmaceutical companies with multiple manufacturing sites, the knowledge graph model extends to an enterprise-wide connected network. Batch records from Site A, material certificates from shared suppliers, and equipment logs from Sites B and C can all be nodes in the same graph, enabling cross-site queries that are currently impossible in siloed-per-site architectures.
A corporate quality team can query product performance across all sites simultaneously, identify whether a raw material attribute varies by site, and detect emerging quality trends at any site before they escalate to regulatory observations.
Mareana Batch Genealogy turns weeks of manual data gathering into a single query. Trace any raw material lot to every batch it touched. Pull the complete equipment qualification history for any process step. Respond to audit requests in minutes with batch records, CoA attributes, and calibration data returned in one traversal. Whether you are investigating a deviation, preparing an annual product review, or assessing recall scope, the manufacturing story is already connected across MES, LIMS, ERP, paper records, and CDMO documentation.
Key Takeaways
- Pharmaceutical manufacturing data is distributed across MES, LIMS, ERP, historians, QMS, document management systems, and paper records — systems that were never designed to be queried across simultaneously.
- A manufacturing knowledge graph stores entities — batches, raw material lots, equipment units, test results, deviations — as nodes connected by persistent, meaningful edges that represent real manufacturing relationships.
- Batch records enter the graph through MES connectors or AI-powered paper digitization. Material certificates enter through document processing that extracts structured CoA data. Equipment logs enter through CMMS connectors or controlled document ingestion.
- The connected network enables investigations that begin with context rather than data gathering, audit responses measured in minutes rather than days, and annual product reviews that are queried rather than manually assembled.
- Relationships must be captured at manufacturing time, from transactional data, to ensure the graph accurately represents historical manufacturing reality — a requirement that is directly relevant to regulatory defensibility.
Read our companion blog : https://mareana.com/blog/genealogy-an-overview-for-pharmaceutical-manufacturers/


 Learn more